Market Outlook December 2017

Market Outlook December 2017

Market Outlook December 2017

As we approach 2018, it‘s time to reconcile the past 365 days of 2017. We are sending off a very exciting and tempestuous year. The stock market is at an all-time high. Volatility is at a record low. Consumer spending and confidence have passed pre-recession levels.

I would like to wish all my readers and friends a happy and prosperous 2018. I guarantee you that the coming year will be as electrifying and eventful as the previous one.


The new tax plan

The new tax plan is finally here. After heated debates and speculations, president Trump and the GOP achieved their biggest win of 2017. In late December, they introduced the largest tax overhaul in 30 years. The new plan will reduce the corporate tax rate to 21% and add significant deductions to pass-through entities. It is also estimated to add $1.5 trillion to the budget deficit in 10 years before accounting for economic growth.

The impact on the individual taxes, however, remains to be seen. The new law reduces the State and Local Tax (SALT) deductions to $10,000. Also, it limits the deductible mortgage interest for loans up to $750,000 (from $1m). The plan introduces new tax brackets and softens the marriage penalty for couples making less than $500k a year. The exact scale of changes will depend on a blend of factors including marital status, the number of dependents, state of residency, homeownership, employment versus self-employment status. While most people are expected to receive a tax-break, certain families and individuals from high tax states such as New York, New Jersey, Massachusetts, and California may see their taxes higher.


Affordable Care Act

The future of Obamacare remains uncertain. The new GOP tax bill removes the individual mandate, which is at the core of the Affordable Care Act. We hope to see a bi-partisan agreement that will address the flaws of ACA and the ever-rising cost of healthcare. However, political battles between republicans and democrats and various fractions can lead to another year of chaos in the healthcare system.


Equity Markets

The euphoria around the new corporate tax cuts will continue to drive the markets in 2018. Many US-based firms with domestic revenue will see a boost in their earnings per share due to lower taxes.

We expect the impact of the new tax law to unfold fully in the next two years. However, in the long run, the primary driver for returns will continue to be a robust business model, revenue growth, and a strong balance sheet.

Momentum

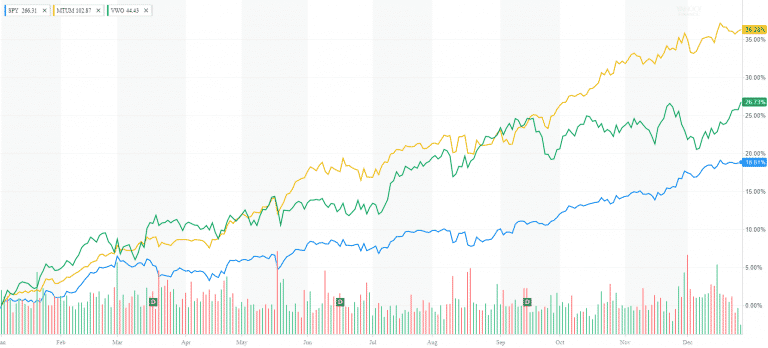
Momentum was the king of the markets in 2017. The strategy brought +38% gain in one of its best years ever. While we still believe in the merits of momentum investing, we are expecting more modest returns in 2018.

Value

Value stocks were the big laggard in 2017 with a return of 15%. While their gain is still above average historical rates, it’s substantially lower than other equity strategies.  Value investing tends to come back with a big bang. In the light of the new tax bill, we believe that many value stocks will benefit from the lower corporate rate of 21%. And as S&P 500 P/E continues to hover above historical levels, we could see investors’ attention shifting to stocks with more attractive valuations.

Small Cap

With a return of 14%, small-cap stocks trailed the large and mega-cap stocks by a substantial margin. We think that their performance was negatively impacted by the instability in Washington. As most small-cap stocks derive their revenue domestically, many of them will see a boost in earnings from the lower corporate tax rate and the higher consumer income.

International Stocks

It was the first time since 2012 when International stocks (+25%) outperformed US stocks. After years of sluggish growth, bank crisis, Grexit (which did not happen), Brexit (which will probably happen), quantitative easing, and negative interest rates, the EU region and Japan are finally reporting healthy GDP growth.

It is also the first time in more than a decade that we experienced a coordinated global growth and synchronization between central banks. We hope to continue to see this trend and remain bullish on foreign markets.

Emerging Markets

If you had invested in Emerging Markets 10-years ago, you would have essentially earned zero return on your investments. Unfortunately, the last ten years were a lost decade for EM stocks. We believe that the tide is finally turning. This year emerging markets stocks brought a hefty 30% return and passed the zero mark. With their massive population under 30, growing middle class, and almost 5% annual GDP growth, EM will be the main driver of global consumption.


Fixed Income

It was a turbulent year for fixed income markets. The Fed increased its short-term interest rate three times in 2017 and promised to hike it three more times in 2018. The markets, however, did not respond positively to the higher rates. The yield curve continued to flatten in 2017. And inflation remained under the Fed target of 2%.

After a decade of low interest, the consumer and corporate indebtedness has reached record levels. While the Dodd-Frank Act imposed strict regulations on the mortgage market, there are many areas such as student and auto loans that have hit alarming levels. Our concern is that high-interest rates can trigger high default rates in those areas which can subsequently drive down the market.


Gold

2017 was the best year for gold since 2010. Gold reported 11% return and reached its lowest volatility in 10 years.  The shiny metal lost its momentum in Q4 as investors and speculators shifted their attention to Bitcoin and other cryptocurrencies. In our view gold continues to be a solid long-term investment with its low correlation to equities and fixed income assets.


Real Estate

It was a tough year for REITs and real estate in general. While demand for residential housing continues to climb at a modest pace, the retail-linked real estate is suffering permanent losses due to the bankruptcies of several major retailers. This trend is driven on one side by the growing digital economy and another side by the rising interest rates and the struggle of highly-leveraged retailers to refinance their debt. Many small and mid-size retail chains were acquired by Private Equity firms in the aftermath of the 2008-2009 credit crisis. Those acquisitions were financed with low-interest rate debt, which will gradually start to mature in 2019 and peak in 2023 as the credit market continues to tighten.

Market Outlook December 2017

In the long-run, we expect that most public retail REITs will expand and reposition themselves into the experiential economy by replacing poor performing retailers with restaurants and other forms of entertainment.

On a positive note, we believe that the new tax bill will boost the performance of many US-based real estate and pass-through entities.  Under the new law, investors in pass-through entities will benefit from a further 20% deduction and a shortened depreciation schedule.


What to expect in 2018

  • After passing the new tax bill, the Congress will turn its attention to other topics of its agenda – improving infrastructure, and amending entitlements. Further, we will continue to see more congressional budget deficit battles.
  • Talk to your CPA and find out how the new bill will impact your taxes.
  • With markets at a record high, we recommend that you take in some of your capital gains and look into diversifying your portfolio between major asset classes.
  • We might see a rotation into value and small-cap. However, the market is always unpredictable and can remain such for extended periods.
  • We will monitor the Treasury Yield curve. In December 2017 the spread between 10-year and 2-year treasury bonds reached a decade low at 50 bps. While not always a flattening yield has often predicted an upcoming recession.
  • Index and passive investing will continue to dominate as investment talent is evermore scarce. Mega large investment managers like iShares and Vanguard will continue to drop their fees.


Happy New Year!


Final words

If you have any questions about your existing investment portfolio, reach out to me at [email protected] or +925-448-9880.

You can also visit our Insights page where you can find helpful articles and resources on how to make better financial and investment decisions.

About the author:

Stoyan Panayotov, CFA is the founder and CEO of Babylon Wealth Management, a fee-only investment advisory firm based in Walnut Creek, CA. Babylon Wealth Management offers personalized wealth management and financial planning services to individuals and families.  To learn more visit our Private Client Services page here. Additionally, we offer Outsourced Chief Investment Officer services to professional advisors (RIAs), family offices, endowments, defined benefit plans, and other institutional clients. To find out more visit our OCIO page here.


End of Summer Market Review

End of Summer Market Review

Happy Labor Day!

Our hearts are with the people of Texas! I wish them to remain strong and resilient against the catastrophic damages of Hurricane Harvey. As someone who experienced Sandy, I can emphasize with their struggles and hope for a swift recovery.


I know that this newsletter has been long past due. However, as wise people say, it is better late than never.

It has been a wild year so far. Both Main and Wall Street kept us occupied in an electrifying thriller of election meddling scandals, health reforms, political battles, tax cuts, interest rate hikes and debt ceiling fights (that one still to unfold).

Between all that, the stock market is at an all-time high. S&P 500 is up 11.7% year-to-date. Dow Jones is up 12.8%, and NASDAQ is up to the whopping 24%. GDP growth went up by 3% in the second quarter of 2017. Unemployment is at a 10-year low. 4.3%.

Moreover, despite record levels, very few Americans are feeling the joy of the market gains and feel optimistic about the future. US families are steadily sitting on the sideline and continuing to pile cash. As of June 2007, the amount of money in cash and time deposits (M2) was 70.1% of the GDP, an upward trend that has continued since the credit crisis in 2008.

End of Summer Market Review

Source: US Fed, https://fred.stlouisfed.org/graph/?g=dZn

Given that the same ratio of M2 as % of GDP is 251% in Japan, 193% in China, 91% in Germany, and 89% in the UK, US is still on the low end of the developed world. However, this is a persistent trend that can reshape the US economy for the years to come.


The Winners

This year’s rally was all about mega-cap and tech stocks. Among the biggest winners so far this year we have Apple (AAPL), up 42%, Amazon (AMZN), 27%, NVIDIA (NVDA), 54%, Adobe, 48%, PayPal, 55%. Netflix, 36%, and Visa (V), 33%,

Probably the biggest story out there is Amazon and its quest to disrupt the way Americans buy things. Despite years of fluctuating earnings, Amazon is still getting full support from its shareholders who believe in its long-term strategy. The recent acquisition of Whole Foods and announcement of price drops, only shows that Amazon is here to stay, and all the key retail players from Costco, Wall-Mart, Target, and Walgreens to Kroger’s, Home Depot, Blue Apron and AutoZone will have to adjust to the new reality and learn how to compete with Amazon.

The Laggards

Costco, Walgreens, and Target are bleeding from the Amazon effect as they reported- 0.49%, -0.74% and -21% year-to-date respectively. Their investors are become increasingly unresponsive to earnings surprises and massively punishing to earnings disappointments.

Starbucks, -0.74%, is still reviving itself after the departure of its long-time CEO, Howard Shultz, and will have to discover new revenue channels and jump-start its growth.

The energy giants, Chevron, -5%, Exxon, -12%, and Occidental Petroleum, -14.5% are still suffering from the low oil prices. With OPEC maintaining current production levels and surge in renewable energy, there is no light at the end of the tunnel. If these low levels continue, I will expect to see a wave of mergers and acquisitions in the sector. Those with a higher risk and yield appetite may want to look at some of the companies as they are paying a juicy dividend – Chevron, 4%, Exxon, 4%, and Occidental Petroleum, 5.4%

AT&T, -7% and Verizon, -5%, are coming out of big acquisitions, which down-the-road can potentially create new revenue channels and diversify away from the otherwise slow growing telecom business. In the near-term, they will continue to struggle in their effort to impress their investors. Currently, both companies are paying above average dividends, 5.15%, and 4.76%, respectively.

And finally, Wells Fargo, -4%. The bank is suffering from the account opening scandals last year and the departure of its CEO.  The stock has lagged its peers, which reported on average, 8% gains this year. While the long-term outlook remains positive, the short-term prospect remains uncertain.


Small Caps

Small Cap stocks as an asset class have not participated in this year’s market rally. Despite spectacular 2016 returns, small cap stocks have remained in the shadow of the uncertainty of the expected tax cuts and infrastructure program expansion. While I believe the Congress will come out with some tax reductions in the near term, the exact magnitude is still unclear. My long-term view of US small caps remains bullish with some near-term headwinds.


International Stocks

After several years of lagging behind US equity markets, international stocks are finally starting to catch up. The Eurozone reported 2% growth in GDP. MSCI EAFE is up 17.5% YTD, and MSCI Emerging Markets is up 28% YTD.

Despite the recent growth, International Developed and Emerging Market stocks remain cheap on a relative basis compared to US Stocks.  I maintain a long-term bullish view on international and EM stocks with some caution in the short-term.

Even though European Central Bank has kept the interest rates unchanged, I believe that its quantitative easing program will slow down towards the end of 2017 and beginning of 2018. The German bund rates will gradually rise above the negative levels. The EUR / USD will breach and remain above 1.20, a level not seen since 2014.

Interest Rates

I am expecting maximum one or may be even zero additional rate hikes this year. Under Janet Yellen, the Fed will continue to make extremely cautious and well-measured steps in raising short term rates and slowing down of its Quantitative Easing program. Bear in mind that the Fed has not achieved its 2% inflation target and any sharp rate hikes can ruin the already fragile balance in the fixed income space.

Real Estate

After eight years of undisrupted growth, US Real Estate has finally shown some signs of slow down. While demand for Real Estate in the primary markets like California and New York is still high, I expect to see some cooling off and normalization of year-over-year price growth

US REITs have reported 3.5% total return year-to-date, which is roughly the equivalent of -0.5% in price return and 4% in dividend yield.

Some retail REITs will continue to struggle in the near-term due to store closures and pressure from online retailers. I encourage investors to maintain a diversified REIT portfolio with a focus on strong management, sustainability of dividends and long-term growth prospects.

Gold

After several years of underperformance, Gold is making a quiet comeback. Gold was up 8% in 2016 and 14% year-to-date. Increasing market and political uncertainty and fear of inflation are driving many investors to safe havens such as gold. Traditionally, as an asset class, Gold has a minimal correlation to equities and fixed income. As such, I support a 1% to 5% exposure to Gold in a broadly diversified portfolio as a way to reduce long-term risk.


About the author: Stoyan Panayotov, CFA is a fee-only investment advisor based in Walnut Creek, CA. His firm Babylon Wealth Management offers fiduciary investment management and financial planning services to individuals and families.


Disclaimer: Past performance does not guarantee future performance. Nothing in this article should be construed as a solicitation or offer, or recommendation, to buy or sell any security. The content of this article is a sole opinion of the author and Babylon Wealth Management. The opinion and information provided are only valid at the time of publishing this article. Investing in these asset classes may not be appropriate for your investment portfolio. If you decide to invest in any of the instruments discussed in the posting, you have to consider your risk tolerance, investment objectives, asset allocation and overall financial situation. Different investors have different financial circumstances, and not all recommendations apply to everybody. Seek advice from your investment advisor before proceeding with any investment decisions. Various sources may provide different figures due to variations in methodology and timing,


10 Ways to reduce taxes in your investment portfolio

10 Ways to reduce taxes in your investment portfolio

Successful practices to help you lower taxes in your investment portfolio

A taxable investment account is any brokerage or trust account that does not come with tax benefits. Unlike Roth IRA and Tax-Deferred 401k plans, these accounts do not have many tax advantages. Your contributions to the account are with after-tax dollars. This is money you earned from salary, royalties, the sale of a property, and so on. All gains, losses, dividends, interest, and other income from any investments are subject to taxes at the current tax rates.  In this post, we will discuss several successful practices that can help you lower taxes in your investment portfolio

Why investors put money into taxable accounts? They provide flexibility and liquidity, which are not available by other retirement accounts. Money is readily accessible for emergencies and unforeseen expenses. Many credit institutions take these accounts as a liquid asset for loan applications.

Since investment accounts are taxable, their owners often look for ways to minimize the tax impact at the end of the year. Several practices can help you reduce your overall tax burden.

1. Buy and Hold

Taxable investment accounts are ideal for buy and hold investors who don’t plan to trade frequently. By doing that investors will minimize trading costs and harvest long-term capital gains when they decide to sell their investments. Long-term capital gains are taxable at a favorable rate of 0%, 15% or 20% plus 3.8% Medicare surcharge. In contrast, short-term gains for securities held less than a year are taxed at the higher ordinary income level.

Individuals and families often use investments accounts for supplemental income and source of liquidity. Those investors are usually susceptible to market volatility. Diversification is the best way to lower market risk. I strongly encourage investors to diversify their portfolios by investing in uncorrelated assets including mid-cap, small-cap, international stocks, bonds, and real assets.

2. Invest in Municipal Bonds

Most municipal bonds are exempt from taxes on their coupon payments. They are considered a safer investment with a slightly higher risk than Treasury bonds but lower than comparable corporate bonds.

This tax exemption makes the municipal bond suitable investment for taxable accounts, especially for individuals in the high brackets category.

3. Invest in growth non-dividend paying stocks

Growth stocks that pay little or no dividends are also a great alternative for long-term buy and hold investors. Since the majority of the return from stocks will come from price appreciation, investors don’t need to worry about paying taxes on dividends. They will only have to pay taxes when selling the investments. 

4. Invest in MLPs

Managed Limited Partnerships have a complex legal and tax structure, which requires them to distribute 90% of their income to their partners. The majority of the distributions come in the form return on capital which is tax-deferred and deducted from the cost basis of the investments. Investors don’t owe taxes on the return on capital distributions until their cost basis becomes zero or decide to sell the MLP investment.

One caveat, MLPs require K-1 filing in each state where the company operates, which increases the tax filing cost for their owners.

 5. Invest in Index Funds and ETFs

Index funds and ETFs are passive investment vehicles. Typically they track a particular index or a benchmark. ETFs and index funds have a more tax-efficient structure that makes them suitable for taxable accounts. Unlike them, most actively managed mutual funds frequently trade in and out of individual holdings causing them to release long-term and short-term capital gains to shareholders.

6. Avoid investments with a higher tax burden

While REITs, taxable bonds, commodities, and actively managed mutual funds have their spot in the investment portfolio, they come with a higher tax burden.

The income from REITs, treasuries, corporate and international bonds is subject to the higher ordinary income tax, which can be up to 39.6% plus 3.8% Medicare surcharge

Commodities, particularly Gold are considered collectibles and taxed at a minimum of 28% for long-term gains.

Actively managed funds, as mentioned earlier, periodically release long-term and short-term capital gains to their shareholders, which automatically triggers additional taxes.

7. Make gifts

You can use up to $14,000 a year or $28,000 for a couple to give to any number of people you wish without tax consequences. You can make gifts of cash or appreciated investments from your investment account to family members at a lower tax bracket than yours.

8. Donate 

You can make contributions in cash for up to 50% of your taxable income to your favorite charity. You can also donate appreciated stocks for up to 30% of AGI. Consequently, the value of your donation will reduce your income for the year. If you had a good year when you received a big bonus, sold a property or made substantial gains in the market, making donations will help you reduce your overall tax bill for the year.

9. Stepped up cost basis

At the current law, the assets in your investment account will be received by your heirs at the higher stepped-up basis, not at the original purchase price. If stocks are transferred as an inheritance directly (versus being sold and proceeds received in cash), they are not subject to taxes on any long-term or short-term capital gains. Your heirs will inherit the stocks at the new higher cost basis.  However, if your investments had lost value over time, you may wish to consider other ways to transfer your wealth. In this case, the stepped-up basis will be lower than you originally paid for and may trigger higher taxes in the future for your heirs.

10. Tax-loss harvesting

Tax-loss harvesting is selling investments at a loss. The loss will offset gains from other the sale of other securities. Additionally, investors can use $3,000 of investment losses a year to offset ordinary income. They can also carry over any remaining amounts for future tax filings.


A Guide to Investing in REITs

Investing in REITs

On August 31, 2016, S&P 500 will introduce a new sector – Real Estate. Up until now real estate companies, also known as REITs,  belonged to the Financial sector. They were in the company of large financial and insurance corporations. The new category will have 27 stocks, $567 billion of market capitalization and an approximate weight of 3% of the total S&P 500 market value.

With the addition of Real Estate as a separate sector in S&P indices, many active managers will have to aline their current portfolios with the new sector structure.

What is a REIT?

A real estate investment trust (REIT) is a company that owns and manages income-producing real estate. It represents a pool of properties and mortgages bundled together and offered as a security in the form of unit investment trusts.

REITs invest in all the main property types with approximately two-thirds of the properties in offices, apartments, shopping centers, regional malls, and industrial facilities. The remaining one-third is divided among hotels, self-storage facilities, health-care properties, prisons, theaters,  golf courses and timber.

The total market capitalization of all publicly-traded REITs is equal to $993 billion. The majority of it, $933 billion belongs to Equity REITs and the remainder to Mortgage and other financing REITs.

There are 219 REITs in the FTSE NAREIT All REITs Index. 193 of them trade on the New York Stock Exchange

Legal  Status

REITs are subject to several regulations. To qualify as a REIT, a real estate firm must pay out 90% of its taxable income to shareholders as dividends. The REIT can deduct the dividends paid to shareholders from its taxable income. Thus their income is exempt from corporate-level taxation and passes directly to investors. Other important regulations include:

  • Asset requirements: at least 75% of assets must be real estate, cash, and government securities.
  • Income requirements: at least 75% of gross income must come from rents, interest from mortgages, or other real estate investments.
  • Stock ownership requirements: shares in the REIT must be held by a minimum of 100 shareholders. Five or fewer individuals cannot (directly or indirectly) own more than 50% of the value of the REIT’s stock during the last half of the REIT’s taxable year.

Distributions

Dividend distributions for tax purposes are allocated to ordinary income, capital gains, and return on capital, each of them having different tax treatment. REITs must provide shareholders with guidance on how to treat their dividends for tax purposes.  The average distribution breakdown for 2015 was approximately 66% ordinary income, 12% return on capital, and 22% capital gains.

REITs distributions have grown substantially in the past 15 years. The total REIT distributions in 2000 were under $8 billion dollar. Just between 2012 and 2015, REITs distribution rose up from $28.8 billion to $44.9 billion, or 44%.

Tax implicationsThe majority of REIT dividends are considered non-qualified dividends and taxed as ordinary income, up to the maximum rate of 39.6 percent, plus a separate 3.8 percent Medicare surtax on investment income.

Capital gains distributions are taxable at either 0, 15 or 20 percent tax rate, plus the 3.8 percent surtax.

Return-on-capital distributions are tax-deferred. They reduce the cost basis of the REIT investment.

When a REIT distributes dividends received from a taxable REIT subsidiary or other corporation, those distributions are taxed at the qualified dividend rate of 0, 15, or 20 percent, plus the 3.8 percent surtax.

Timber REITs

One REIT sector makes an exception from the above rule. Timber REITs have a favorable tax treatment from the IRS. Distributions from timber REITs such as RYN, PCL, PCN & WY are considered long-term capital gains and therefore are taxable at the lower capital gain rate (0, 15% or 20% plus 3.8% Medicare surcharge).

 Economic Cycle 

Individual REIT sectors have different sensitivity to cyclical factors.  Industrial, hotel, and retail REITs have the biggest exposure to economics cycles. Their occupancy and rental rates are extremely sensitive to economic conditions. Cyclical downturns in the economy, recession, and weak consumer spending, can significantly hurt the revenue stream of these REITs.

On the other hand, health care REITs tend to have long-term rental agreements and are more sheltered from market volatility.

Interest Rates

Since many REITs use bank loans and other external financings to expand their business, they have benefitted significantly from the current low-interest-rate environment. Furthermore, many yield-seeking investors turned to REITs for higher income. If low-interest rates remain, REITs will likely expand their base to a broader range of market participants.

Interest rates can impact REIT’s performance differently depending on two main factors – debt and lease duration.

Loan maturities

As a result of the current low rates, many REITs have increased their leverage and therefore have high sensitivity to interest changes. If interest rates rise, REITs with near-term loan maturities will need to refinance at higher rates. Thus their interest payments will go up, which will lead to less cash available for dividends. Therefore, REITs with higher levels of debt and short-term maturities will perform worse than REITs with less debt and long-dated maturity schedules.

At the same time, REITs with lower debt levels relative to their cash flows, all else equal, will perform better in a rising-rate environment.

Lease duration

While higher interest rates would affect all REITs, industry subsectors would be affected differently, depending on lease durations. REITs with shorter lease durations will perform relatively better in a rising-rate environment because they can seek higher rents from tenants as rates rise than could REITs with longer lease durations. The higher rents can offset the negative impact of higher interest expense. Hotel REITs usually have the shortest lease durations, followed by multifamily properties and self-storage.

Healthcare, office, and retail REITs usually sign long-term leases. Therefore rising interest rates will potentially hurt these REITs due to their inability to adjust rental contracts to offset rising costs.

Risk and return

Real Estate Investment Trusts historically have been more volatile than S&P 500. The 40-year standard deviation of the REIT’s sector is 17.16% versus 16.62% for the S&P 500 and 10.07% for the 10-year Treasury. During this 40-year period, REITs achieved a 13.66% cumulative annual return versus 11.66% for S&P 500 and 7.39% for the 10-year Treasury. (www.portfoliovisualizer.com)

Furthermore, the 10-year (2006-15) standard deviation of the REIT sector is 22.01% versus 18.02% for the S&P 500 and 9.54% for 10-year Treasury. For the same period, REITs reported 7.83% cumulative annual return versus 6.96% for S&P 500 and 4.57% for 10-year Treasury. (www.portfoliovisualizer.com)

Among the best five-year REIT sector performers were Retail, Self-Storage, and Industrial. For the same period, worst performers were Mortgage, Hotel and Office RETS.

Valuations

With respect to pricing, REITs are reaching high valuations levels. The current Price to Fund to Operations ratio is hovering around 18, which is slightly above the historical average of 16. While the P/FFO ratio remain reasonable compared to historical figures, further price rally in REITs not supported by the increase in cash flows may impose a significant risk for sector overheating.

Diversification

Even though REITs are publicly traded companies, very often they are considered an alternative asset due to their weak relationship with the other asset classes – equities and fixed income. US REITs have a relatively low correlation with the broader stock market. The 40-year correlation is equal to 0.51, while the 10-year correlation is  0.73. The correlation between REITs and 10-year Treasury is equal to -0.06, while that with Gold is 0.09.

This low correlation with other asset classes makes the REITs a solid candidate for a broadly diversified investment portfolio.


Investing Strategies

Directly

There are 219 publicly-traded REITs. 27 of them are included in the S&P 500 index. If you decide to invest in a single REIT or basket of REITs, you need to consider company-specific risk, management, sub-sector, regional or national market exposure, leverage, lease duration, history, and distribution payments.

Real Estate ETFs

VNQ

VNQ dominates the REITs ETF space as the largest and second-cheapest ETF. It includes a broad basket of 150 securities. The ETF tracks the MSCI US REIT Index, which includes all domestic REITs from the MSCI US Investable Market 2500 Index. This ETF doesn’t include any mortgage, timber, and tower REITs. It has an expense ratio of 0.12% (second lowest to SCHH). It has $32.4 billion of assets under management and Morningstar rating of 4. The fund holds a diversified portfolio across all property sectors. Retail REITs are the largest holding, at 25% of assets, Specialized REITs make up 16.50%, office, 12.6% residential, 15.7%, healthcare, 12.3%, diversified, 8%, hotel and resort, 5.3%, and industrial, 4.7% REITs.

IYR

IYR tracks the Dow Jones U.S. Real Estate Index. It is the most diversified REIT ETF. Unlike other ETFs which hold only equity REITs, IYR holds mortgage, timber, prison and tower REITs including companies like American Tower, Weyerhaeuser Co, Annaly Capital Management NLY and Crown Castle International Corp. IYR has three stars by Morningstar and has an expense ratio of 0.45%. IYR’s holdings are broken by Specialized REITs, (27.09%), Retail, 19.74%, Residential, 12.70%, Office, 10.00%, Health Care, 9.88%, Mortgage REITs, 4.90%, Industrial, 4.56%, Diversified, 4.51%, Hotel & Resort, 3.56%, Real Estate Services, 2.06%

ICF

ICF tracks an index of the 30 largest publicly traded REITs excluding mortgage and tower REITs. The design of this index capitalizes on the relative strength of the largest real estate firms and the conviction for consolidation in the real estate market. The ETF includes Retail REITs, 24.84%, Specialized REITs, 18.71%, Residential, 18.08%, Office, 15.23%, Health Care, 14.41%, Industrial, 5.79%, Hotel & Resort REITs, 2.56%.

RWR / SCHH

RWR / SCHH are the smallest of the five funds. They track Dow Jones US Select REIT Index. The index tracks US REITs with a minimum market cap of $200 million. The index also excludes mortgage REITs, timber REITs, net-lease REITs, real estate finance companies, mortgage brokers and bankers, commercial and residential real estate brokers and real estate agents, homebuilders, hybrid REITs, and large landowners of unimproved land. The funds’ portfolio holds a diversified range of REITs across property sectors similar to other ETFs.

SCHH has the lowest expense ratio of 0.07% all REITs ETFs while RWR has an expense ratio of 0.25%.

Performance 

Comparing the performance of the top ETFs in the past ten years, we can see a clear winner. VNQ is leading by price return, total return, and Sharpe Ratio.  Next in line are RWR and ICF. IYR takes the last spot.

Having the largest number of holdings, VNQ overweights small size REITs relative to the industry average. Hence it benefited from the smaller REITs outpacing the growth of their bigger competitors.

IYR did not benefit from being the most diversified REIT ETF. The mortgage and specialized REITs have lagged behind the performance of the traditional equity REITs.

Mutual Funds

Mutual funds are actively managed investment vehicles. They typically use an index as their benchmark.  The goal of the fund manager is to outperform their benchmark either on a risk adjusted or absolute return basis.  The fund manager can decide to overweight a particular REIT if he or she believes the company will outperform the benchmark. Many times the managers will look for mispricing opportunities of individual REITs.

Active funds usually charge higher fees than passively managed ETFs due to higher research, management, administrative and trading costs. However, many investors believe that after subtracting their fees, active managers cannot beat the market in the long run.

In my analysis, I selected a pool of five actively managed funds which are open to new investors and have an expense ratio less than 1% – VGSLX,  DFREX, TRREX, CSRSX and FRESX.

All five funds have high ratings from Morningstar and robust historical performance.

VGSLX and DFREX have the largest number of holdings, 150 and 149 respectively, and maintain the lowest expense ratio. Both funds lean more towards small and micro-cap REITs relative to the average in the category.

The other three funds, TRREX, CSRSX and FRESX manage smaller pools of REITs. CSRSX and FRESX have the highest turnover: 58% and 34% respectively.

Performance

While the 1-year returns are quite variable, the long-term performance among the five funds is relatively consistent. Vanguard REIT Index Fund, VGSLX,  has the lowest fee and the highest 10-year return of 7.6%. Cohen & Steers Realty Shares Fund, CSRSX, is second with 7.5% annual return. CSRSX has the lowest 10-year standard deviation of 25.2%. VGSLX edges slightly ahead with the highest Sharpe Ratio of 0.39. Vanguard and DFA funds benefitted from low expense ratio and larger exposure to mid and small size REITs, which had better 10-year performance than larger REITs.

It is worth noting that the 10-year Sharpe Ratio for all REITs sector is lower than the Sharpe Ratio of S&P 500. The Sharpe Ratio calculated the risk-adjusted returns of a particular investment. In this case, the risk-adjusted returns of REIT lag behind the overall equity market.

When you consider investing in REITs mutual funds,  pay attention to management style, expense ratio, turnover, dividends, the number of holdings, and their benchmark.

Where to allocate REITs investments?

REITs are often attractive for their high dividend income. As I mentioned earlier, the majority of the REITs distributions are treated as ordinary income and therefore taxed at the investors’ tax rate. Investors in high tax brackets can pay up to 39.6% rate plus 3.8% Medicare surplus tax on the investment income.

Because of their unfavorable tax status, most REITs may not be suitable for taxable investment accounts.  Tax-sensitive investors may want to consider placing REITs in Tax Advantage accounts like Roth IRA, Traditional IRA, and 401k.

Since timber REITs receive favorable tax treatment, they are an exception from the above rule. Investors may choose to hold them in taxable investment accounts.

There are two scenarios under which REITs could be an appropriate fit for a taxable account.

First, investors in the lower tax bracket will be less impacted by the tax treatment of the REITs income.

Second, investing in REITs with a history of making significant capital gain and return on capital distributions. These types of payments have more favorable tax treatment at the lower long-term capital gains tax rate.