Navigating the market turmoil after the Coronavirus outbreak

Navigating the market turmoil after the Coronavirus outbreak

Here is how to navigate the market turmoil after the Coronavirus outbreak, the stock market crash, and bottom low bond yields.

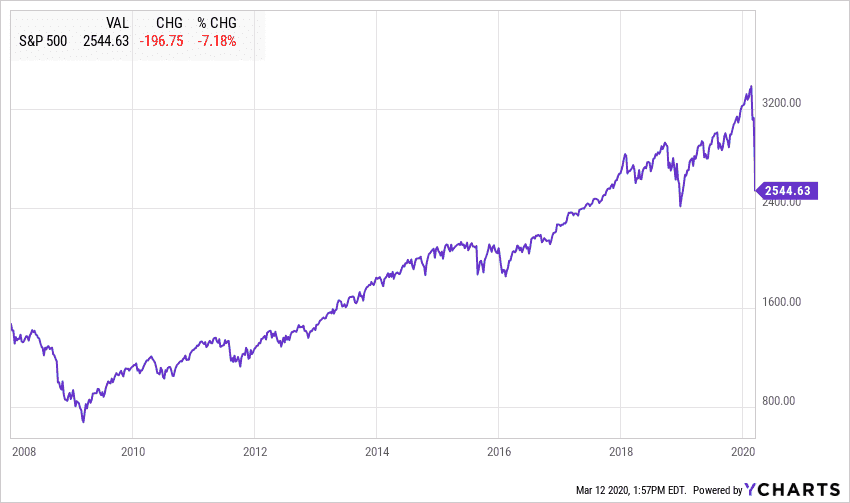
The longest bull market in history is officially over. Today the Dow Jones recorded its biggest daily loss since the October crash in 1987.  Today will remain in the history books. After the Dow Jones index dropped more than 20% from its February 2020 high, we are formally in a bear market.

Navigating the market turmoil after the Coronavirus outbreak
S&P 500 12 year performance

Investors’ flight to safety has pushed 10-year Treasury rate to 0.8% and 30-year treasury to 1.4%, all-time lows.

Navigating the market turmoil after the Coronavirus outbreak

Where are we standing

The coronavirus outbreak is spreading globally. The virus fears are halting public events and forcing companies to change the way they conduct business. The US has imposed travel restrictions on China and the European Union. Many countries in the US are imposing border control restrictions on their neighbors. While the virus outbreak in Wuhan is officially contained according to the Chinese government, large parts of the country remain in lockdown.
The inability of governments around the world to contain COVID-19 spooked investors. We are now observing the worst stock market selloff since the financial crisis of 2008. In certain ways, the daily market conditions are more brutal and unpredictable than a decade ago. Currently, close to 80% of the stock trading is generated by computer algorithms who can send thousands of trades in milliseconds.

Date Dow Jones Index Change % Change
12-Mar-20 21,200.95 -2,352.27 -9.99%
11-Mar-20 23,553.22 -1,464.94 -5.86%
10-Mar-20 25,018.16 1,167.14 4.89%
9-Mar-20 23,851.02 -2,013.76 -7.79%
6-Mar-20 25,864.78 -256.50 -0.98%
5-Mar-20 26,121.28 -969.58 -3.58%
4-Mar-20 27,090.86 1,173.45 4.53%
3-Mar-20 25,917.41 -785.91 -2.94%
2-Mar-20 26,703.32 1,293.96 5.09%
28-Feb-20 25,409.36 -357.28 -1.39%
27-Feb-20 25,766.64 -1,190.95 -4.42%
26-Feb-20 26,957.59 -123.77 -0.46%
25-Feb-20 27,081.36 -879.44 -3.15%
24-Feb-20 27,960.80 -1,031.61 -3.56%

The virus fears initially caused by a meltdown in travel-related stocks. Many airline and cruise ship stocks are now trading at a multi-year low. The heightened concerns for the global recession and the lowered commodity demand from China pushed the price of the oil down significantly. After failed negotiations between OPEC and Russia, Saudi Arabia decided to lower the sale prices of oil by 20% and increase its daily output. In turn, the prices of US oil companies collapsed due to fears that US oil producers can not maintain profitable operations at these low levels. During the previous in 2016, many small oil producers shut down or filed for bankruptcy. The expectation is that many more will follow the same faith soon.
Since the oil and gas and travel-related industry make up for more than 10% of the US GDP, it’s easy to understand that lower revenues and potential job cuts can trickle down to the rest of the US economy.

Are we in a recession?
We wouldn’t know the exact figures until April. The likelihood that the US economy will be in recession in Q1 and Q2 of 2020 is very high. The best-case scenario is for a sluggish economy. We started the year on a strong footing with low employment and strong job growth and housing sales, low price of oil and low-interest rates. However, the crisis in US travel, entertainment, and the energy sector can push the economy down.

What can you do now?

Focus on what you can control.

Have a plan
Having a robust financial plan will help you ensure that you are following of your long-term financial goals and staying on track. The investment performance of your portfolio is a key component of your future financial success but it’s not the most important factor. Be disciplined, patient and consistent in following your long-term goals while putting emotions aside
If you don’t have a financial plan, this a perfect time to initiate it. A holistic financial will help you create a comprehensive view of your personal and financial life and have a clear understanding of core risks and abilities to achieve financial independence and confidence.

Do not read the headlines

Wall Street resides in its own bubble and often overreacts to news whether that is good or bad. Right now, all news is bad news. The only thing that will provide confidence in the market is finding a treatment against the COVID-19, which is probably months or weeks away or drop in virus cases in both the US and Europe. A coordinated effort between the Fed, the Congress and the current administration can provide some stability. Let’s hope that all interested parties can come together and create a working plan.

Assess your risk tolerance
Risk tolerance is how we measure our emotional ability to accept market volatility. It’s not always easy to quantify emotions with numbers. As humans, we are always more likely to be risk-averse during market turbulence and more risk-tolerant when the stock market is going higher. If you want to know how you would feel when the stock market drops 20%, open your investment account today. When you are willing to accept short losses, then your risk tolerance is high. If losses are unacceptable then your risk tolerance is very low.

Review your investment portfolio

Perhaps not today, but soon, you should review your investment portfolio in connection with your long-term financial plan and risk tolerance. Make sure that your investments are aligned with your financial goals and needs.

Do not drop your 401k

One of the biggest mistakes you could possibly make now is to drop and stop contributing to your 401k plan. Many people gave up on their retirement savings during the financial crisis and never restarted them. As a result, we have a generation of people with no retirement savings. As a 401k participant, you make regular monthly or semi-monthly payments to your plan. Despite current losses, you benefit from dollar-cost averaging and buying stocks at lower prices.

Invest now

It may sound crazy but if you are a new investor there is no better time to start investing than now. Stocks rarely go on sale. This is one of those opportunities that come only once in a decade. Remember Warren Buffet’s famous quote:

Be fearful when others are greedy and to be greedy only when others are fearful”

Check my blog for guidance and ideas

  • In late January I posted “How to Survive the Next Market Downturn”. I didn’t think that we will need my guide so soon but here we are. I offer nine steps on how to navigate any stock market crash.


  • If you are a conservative investor, who mostly invests in bonds, you were probably somewhat sheltered from the March Market Madness. However, the future for income-seeking investors is cloudy. Current bond yields cannot support future bond investors and will likely deteriorate the economy. For more information on how to traverse from here, read my article on “Why negative interest rates are bad for your portfolio


  • Amid market volatility and uncertainty, dividend growth ETFs can provide some shelter. In my latest article “Top 5 Dividend Growth ETFs” I discuss five ETF strategies that offer lower volatility and extra income.

Final words
If you have any questions about your investments and how to update your financial plan, feel free to reach out. if you are worried about finances I am here to listen and help.

Market Outlook October 2019

market Outlook October 2019

Highlights:

  • S&P 500 recorded a modest gain of 0.9% in the third quarter of 2019
  • Ten-year treasury rate dropped to 1.5% before bouncing back to 1.75%
  • S&P 500 dividend yield is now higher than the 20-year treasury rate
  • Manufacturing index hits contraction territory

Economic Overview

  • The US economy continues to show resiliency despite increased political uncertainty and lower business confidence
  • The consumer sentiment – The US consumer is going strong. Consumer sentiment reached 93 in September 2019. While below record levels, sentiment remains above historical levels. Consumer spending, which makes up 68% of the US GDP, continues to be the primary driver of the economy.
Market Outlook October 2019 Consumer Sentiment
Consumer Sentiment
  • Unemployment hits 3.5%, the lowest level since 1969
  • Wage growth of 2.9% remains above-target inflation levels
  • Household debt to GDP continues to trend down and is now at 76%.
Market Outlook October 2019
Household debt to GDP
  • Fed rate cuts – Fed announced two rate cuts and is expected to cut twice until the end of the year.
  • The 10-year treasury rate is near 1.75%
  • The 30-year mortgage rate is near 3.75%
  • While low-interest rates and low unemployment continue to lift consumer confidence, the question now is, “Can the US consumer save the economy from recession’?
  • The probability of recession is getting higher. Some economists assign a 25% chance of recession by the end of 2020 or 2021.
  • The ISM Manufacturing index dropped to 47 in September, falling under for a second consecutive month. Typically readings under 50 show a sign of contraction and reading over 50 points to expansion. The ISM index is a gauge for business confidence and shows the willingness of corporate managers to higher more employees, buy new equipment and reinvest in their business.
  • Trade war – What started as tariff threats in 2018 have turned into a full-blown trade war with China and the European Union. The Trump administration announced a series of new import tariffs for goods coming from China and the EU. China responded with yuan devaluation and more tariffs. France introduced a new digital tax that is expected to impact primary US tech giants operating in the EU.
  • A study by IHS Markit’s Macroeconomic Advisers calculated that gross domestic product could be boosted by roughly 0.5% if uncertainty over trade policy ultimately dissipates.
  • Chinese FX and Gold reserves – China’s reserve assets dropped by $17.0b in September, comprising of $14.7bn drop in FX reserves and a $2.4bn decline in the gold reserves. China has been adding to its gold reserves for ten straight months since December 2018.
  • Political uncertainty – Impeachment inquiry and upcoming elections have dominated the news lately. Fears of political gridlock and uncertainty are elevating the risk for US businesses.
  • Slowing global growth – The last few recessions were all domestically driven due to asset bubbles and high-interest rates. This time could be different, and I do not say that very often. Just two years ago, we saw a consolidated global growth with countries around the world reporting high GDP numbers. This year we witness a sharp turn and a consolidated global slowdown. EU economies are on the verge of recession. The only thing that supports the Eurozone is the negative interest rates instituted by the ECB. China reported the slowest GDP growth in decades and announced a package of fiscal spending combined with tax cuts, regulatory rollbacks, and targeted monetary easing geared to offset the effect of the trade war and lower consumer spending. So even though the US economy is stable, a prolonged slowdown of global economies could drag the US down as well.

Equities

US Equities had a volatile summer. Most indices are trading close to or below early July levels and only helped by dividends to reach a positive quarterly return. On July 27, 2019, S&P 500 closed at an all-time high of 3,025, followed by an August selloff. A mid-September rally helped S&P 500 pass 3,000 level again, followed by another selloff. S&P 500 keeps hovering near all-time highs despite increased volatility, with 3,000 remaining a distinct level of resistance.

In a small boost for equities, the dividend yield on the S&P 500 is now higher than the 10- and 20- year US Treasury rate and barely below the 30-year rate of 2%.

For many income investors equities become an alternative to generate extra income over safer instruments such as bonds

Market Outlook October 2019
S&P 500 dividend versus 20-year treasury rate

Growth versus Value

Investing in stocks with lower valuations such as price to earnings and price to book ratios has been a losing strategy in the past decade. Investors have favored tech companies with strong revenue growth often at the expense of achieving profits. They gave many of those companies a pass in exchange for a promise to become profitable in the future.

However, while economic uncertainty is going up, the investors’ appetite for risk is going down. The value trade made a big comeback over the summer as investors flee to safe stocks with higher dividends. As a result, the utilities and consumer staple companies have outperformed the tech sector.

The IPO market

The IPO market is an indicator of the strength of the economy and the risk appetite of investors. In 2019, we had multiple flagship companies going public. Unfortunately, many of them became victims of this transition to safety. Amongst the companies with lower post IPO prices are Uber, Lyft, Smiles Direct Club, and Chewy.com. Their shares were down between -25% and -36% since their inception date. Investors walked away from many of these names looking for a clear path to profitability while moving to safety stocks.

Market Outlook October 2019, Uber and Lyft since IPO

Small-Cap

Small caps have trailed large caps due to increased fears of recession and higher market volatility. Small caps tend to outperform in a risk-on environment, where investors have a positive outlook on the economy.

Market Outlook October 2019, Small Cap versus Large Cap

International Stocks

International stocks continue to underperform. On a relative basis, these stocks are better valued and provide a higher dividend than US stocks. Unfortunately, with a few exceptions, most foreign stocks have been hurt by sluggish domestic and international demand and a slowdown in manufacturing due to higher tariffs. Many international economies are much more dependent on exports than the US economy.

Fixed Income

The Fed continued its accommodative policy and lowered its fund rate twice over the summer. Simultaneously, other Central Banks around the world have been cutting their rates very aggressively.

The European Central Bank went as far as lowering its short-term funding rate to -0.50%. As a result, the 30-year German bund is now yielding -0.03%. The value of debt with negative yield reached $13 trillion worldwide including distressed issuers such as Greece, Italy, and Spain.

Investors who buy negative-yielding bonds are effectively lending the government free money.

In one of my posts earlier in 2019, I laid out the dangers of low and negative interest rates. You can read the full article here. In summary, ultra-low and negative interest rates change dramatically the landscape for investors looking to supplement their income by buying government bonds. Those investors need to take more risk in their search for income. Low rates could also encourage frivolous spending by politicians and often lead to asset bubbles.

The Yield Curve

The yield curve shows what interest rate an investor will earn at various maturities. Traditionally, longer maturities require a higher interest rate as there is more risk to the creditor for getting the principal back. The case when long-term rates are lower than short-term rates is called yield inversion. Some economists believe that a yield inversion precedes a recession. However, there is an active debate about whether the difference between 10y and 2y or 10y and 3m is a more accurate indicator.

Market Outlook October 2019, Yield Curve

As you can see from the chart, the yield curve gradually inverted throughout the year. Short-term bonds with 3-month to maturity are now paying higher interest than the 10-year treasury

Credit spreads

The spread between AAA investment-grade and lower-rated high yield bonds is another indicator of an imminent credit crunch and possible economic slowdown.

Market Outlook October 2019, Credit Spreads

Fortunately, corporate rates have been declining alongside treasury rates. Spreads between AAA and BBB-rated investment grade and B-rated high yield bonds have remained steady.

Repo market crisis

The repo market is where banks and money-market funds typically lend each other cash for periods as short as one night in exchange for safe collateral such as Treasuries. The repo rates surged as high as 10% in mid-September from about 2.25% amid an unexpected shortage of available cash in the financial system. For the first time in more than a decade, the Federal Reserve injected cash into the money market to pull down interest rates.

The Fed claimed that the cash shortage was due to technical factors. However, many economists link the shortages of funds as a result of the central bank’s decision to shrink the size of its securities holdings in recent years. The Fed reduced these holdings by not buying new ones when they matured, effectively taking money out of the financial system.

Gold

Gold has been a bright spot in our portfolio in 2019. After several years of dormant performance, investors are switching to Gold as protection from market volatility and low-interest rates. In early September, the precious metal was up nearly 21% YTD, but since then, retracted a bit.

Market Outlook October 2019, Gold

Gold traditionally has a very low correlation to both Equities and Bonds. Even though it doesn’t generate income, it serves as an effective addition to a well-diversified portfolio.

The Gold will move higher if we continue to experience high market volatility and uncertainty on the trade war.

Final words

The US economy remains resilient with low unemployment, steadily growing wages, and strong consumer confidence. However, few cracks are starting to appear on the surface. Many manufacturers are taking a more cautious position as the effects of the global slowdown and tariffs are starting to trickle back to the US. An inverted yield curve and crunch in the repo market have raised additional concerns about the strength of the economy.

Despite the media’s prolonged crisis call, we can avoid a recession. The recent trade agreement between the US and Japan could open the gate for other bilateral trade agreements. Given that the US elections are around the corner, I believe that this administration has a high incentive to seal trade agreements with China and the EU.

The market is expecting two more Fed cuts for a total of 0.5% by the end of the year. If this happens, the Fed fund rate will drop to 1.25% – 1.5%, possibly flattening or even steepening the yield curve, which will be a positive sign for the markets.

Those with mortgage loans paying over 4% in interest may wish to consider refinancing at a lower rate.

Market volatility is inevitable. Keep a long-term view and maintain a well-diversified portfolio.

The end of the year is an excellent time to review your retirement and investment portfolio, rebalance and take advantage of any tax-loss harvesting opportunities.

About the author:

Stoyan Panayotov, CFA, founder of Babylon Wealth Management

Stoyan Panayotov, CFA, MBA is the founder of Babylon Wealth Management and a fee-only financial advisor in Walnut Creek, CA, serving clients in the San Francisco Bay Area and nationally. Babylon Wealth Management specializes in financial planning and investment management for growing families, physicians, and successful business owners.


If you have any questions about the markets and your investments, reach out to me at [email protected] or +1-925-448-9880.

You can also visit my Insights page, where you can find helpful articles and resources on how to make better financial and investment decisions.

Subscribe to get our newest Insights delivered right to your inbox

Latest Articles

Market Outlook July 2019

Market Outlook July 2019

Breaking records

So far 2019 has been the year of breaking records. We are officially in the longest economic expansion, which started in June of 2009. After the steep market selloff in December, the major US indices have recovered their losses and reached new highs. The hopes for a resolution on trade, the Fed lowering interest rates and strong US consumer spending, have lifted the markets.  At the same time, many investors remain nervous fearing an upcoming recession and slowing global growth.

S&P 500 in record territory

S&P 500 hit an all-time high in June, which turned out to be best June since 1938. Furthermore, the US Large Cap Index had its best first quarter (January thru March) and the best first half of the year since the 1980s.

S&P 500 Performance since January 2018
Market Outlook July 2019

US treasuries rates declined

Despite the enthusiasm in the equity world, fixed income investors are ringing the alarm bell. 10-year treasury rate dropped under 2%, while 2-year treasuries fell as low as 1.7%.

10-year Treasury versus 2-year treasury and 3-month treasury.

We continue to observe a persistent yield inversion with the 3-month treasury rates higher than 2-year and 10-year rates. Simultaneously, the spread between the 2 and 10-year remains positive. Historically, a yield inversion has been a sign for an upcoming recession. However, most economists believe that the 2-10-year spread is a better indicator than the 3m-10-year spread.

Gold is on the move

Gold passed 1,400. With increased market volatility and investors fears for a recession, Gold has made a small comeback and reached $1,400, the highest level since 2014.

Bonds beating S&P 500

Despite the record highs, S&P 500 has underperformed the Bond market and Gold from October 2018 to June 2019 S&P 500 is up only 1.8% since October 1, 2018, while the 10-year bond rose 8.7% and Gold gained 16.8%. For those loyal believers of diversification like myself, these figures show that diversification still works.

S&P 500 versus 10-year treasury and Gold

Defensive Stocks lead the rally in Q2

Consumer Staples and Utilities outperformed the broader market in Q2 of 2019. The combination of lower interest rates, higher market volatility and fears for recessions, have led many investors into a defensive mode. Consumer staples like Procter & Gamble and Clorox together with utility giants like Southern and Con Edison have led the rally in the past three months.

Utilities and Consumer Staples performance versus S&P 500.

Small-Cap lagging

Small cap stocks are still under all-time high levels in August of 2018. While both S&P 600 and Russell 2000 recovered from the market selloff in December o 2018, they are still below their record high levels by -13.6% and 10% respectively

S&P 600 and Russell 2000 9-month performance.

International Stocks disappoint

International Developed and Emerging Stocks have also not recovered from their record highs in January of 2018.  The FTSE International Developed market index is 13.4% below its highest levels. While MSCI EM index dropped nearly 18.3% from these levels.

International stocks performance

The Fed

After hiking their target rates four times in 2018, the Fed has taken a more dovish position and opened the door for a possible rate cut in 2020 if not sooner. Currently, the market is expecting a 50-bps to a 75-bps rate cut by the end of the year.

As I wrote this article, The Fed chairman Jerome Powell testified in front of congress that crosscurrents from weaker global economy and trade tensions are dampening the U.S. economic outlook. He also said inflation continues to run below the Fed’s 2% target, adding: “There is a risk that weak inflation will be even more persistent than we currently anticipate.”

Unemployment

The unemployment rate remains at a record low level at 3.7%. In June, the US economy added 224,000 new jobs and 335,000 people entered the workforce. The wage growth was 3.1%.

Consumer spending

The US consumer confidence remains high at 98 albeit below the record levels in 2018. Consumer spending has reached $13 trillion. Combined with low unemployment, the consumer spending will be a strong force in supporting the current economic expansion.

Manufacturing is weakening

The Institute for Supply Management (ISM) reported that its manufacturing index dropped to 51.7 in June from 52.1 in May. Readings above 50 indicate activity indicate expanding, while those below 50 show contraction. While we still in the expansion territory, June 2019 had the lowest value since 2016. Trade tensions with China, Mexico, and Europe, and slowing global growth have triggered the alarm as many businesses are preparing for a slowdown by delaying capital investment and large inventory purchases.  

Trade war truce for now

The trade war is on pause. After a break in May, the US and China will continue their trade negotiations. European auto tariffs are on hold. And raising tariffs on Mexican goods is no longer on the table (for now). Cheering investors have lifted the markets in June hoping for a long-term resolution.

Dividend is the king

With interest rates remaining low, I expect dividend stocks to attract more investors’ interest. Except for consumer staples and utilities, dividend stocks have trailed the S&P 500 so far this year. Many of the dividend payers like AT&T, AbbVie, Chevron, and IBM had a lagging performance. However, the investor’s appetite for income could reverse this trend.

The 3,000

As I was writing this article the S&P 500 crossed the magical 3,000. If the index is able to maintain this level, we could have a possible catalyst for another leg up of this bull market.

The elections are coming

The US Presidential elections are coming.  Health Care cost, rising student debt, income inequality, looming retirement crisis, illegal immigration, and the skyrocketing budget deficit will be among the main topics of discussion. Historically there were only four times during an election year when the stock market crashed. All of them coincided with major economic crises – The Great Depression, World War II, the bubble, and the Financial crisis.  Only one time, 1940 was a reelection year.

S&P 500 Returns During Election Years

YearReturnCandidates
192843.60%Hoover vs. Smith
1932-8.20%Roosevelt vs. Hoover
193633.90%Roosevelt vs. Landon
1940-9.80%Roosevelt vs. Willkie
194419.70%Roosevelt vs. Dewey
19485.50%Truman vs. Dewey
195218.40%Eisenhower vs. Stevenson
19566.60%Eisenhower vs. Stevenson
19600.50%Kennedy vs. Nixon
196416.50%Johnson vs. Goldwater
196811.10%Nixon vs. Humphrey
197219.00%Nixon vs. McGovern
197623.80%Carter vs. Ford
198032.40%Reagan vs. Carter
19846.30%Reagan vs. Mondale
198816.80%Bush vs. Dukakis
19927.60%Clinton vs. Bush
199623.00%Clinton vs. Dole
2000-9.10%Bush vs. Gore
200410.90%Bush vs. Kerry
2008-37.00%Obama vs. McCain
201216.00%Obama vs. Romney
201611.90%Trump vs. Clinton

Final words

The US Economy remains strong despite headwinds from trade tensions and slowing global growth. GDP growth above 3% combined with a possible rate cut lat and resolution of the trade negotiations with China, could lift the equity markets another 5% to 10%.

Another market pullback is possible but I would see it as a buying opportunity if the economy remains strong.

If your portfolio has extra cash, this could be a good opportunity to buy short-term CDs at above 2% rate.

Reach out

If you have any questions about the markets and your investment portfolio, reach out to me at [email protected] or +925-448-9880.

You can also visit my Insights page where you can find helpful articles and resources on how to make better financial and investment decisions.

About the author:

Stoyan Panayotov, CFA, MBA is a fee-only financial advisor in Walnut Creek, CA, serving clients in the San Francisco Bay Area and nationally. Babylon Wealth Management specializes in financial planning, retirement planning, and investment management for growing families and successful business owners.

Market Outlook 2019

2019 Market Outlook

Happy New Year to all!

2018 kept us on our toes. It seems that 2019 is promising to do the same.

All major world indices posted declines in 2018. S&P 500 finished lower by -4.5%. While the small-cap S&P 600 was down-8.5%. The International MSCI EAFE closed -13.8% cheaper for the year. The Bloomberg Aggregate Bond Index finished 2018 barely positive with most gains generated in the last quarter as most investors moved to Treasuries as a result of the increased volatility in the equity markets. Gold also ended in negative territory despite the 7.5% gain in the last quarter.

Major indices in 2018

Index Q1 2018 Q2 2018 Q3 2018 Q4 2018 FY 2018
S&P 500 Large-Cap (SPY) -1.00% 3.55% 7.65% -13.52% -4.56%
S&P 600 Small-Cap (IJR) 0.57% 8.69% 4.87% -20.18% -8.49%
MSCI EAFE (EFA) -0.90% -1.96% 1.52% -12.62% -13.81%
Barclays US Aggregate Bond (AGG) -1.47% -0.18% -0.08% 1.85% 0.10%
Gold (GLD) 1.73% -5.68% -4.96% 7.53% -1.94%

Source: Morningstar

We will remember 2018 with the return of volatility. Investors enjoyed relatively calm markets in 2017, which had only 8 trading days when the S&P 500 moved more than 1% in either direction, 5 down and 3 up days. For comparison, 2018 had 65 trading days when the index moved more than 1%, split evenly between positive and negative days. Overall 2018 had more positive trading days 131 versus 119. However, the average positive session was +0.69% versus the average negative session of -0.81%.

CBOE Volatility Index (^VIX) – 2017-2018

2019 Market Outlook. CBOE Volatility Index (^VIX) – 2017-2018
Source: Yahoo Finance

So, what led to this outcome. Unlike other bear markets, no single catalyst that caused this market selloff. But there was a combination of factors that formed a perfect storm and pushed the markets over the edge. In my previous post from November and December 2018, I talked about a list of these factors. Let me go over some of the most important ones.

Corporate buybacks

A big contributor to the positive returns earlier in the year was the companies’ share buybacks. After TCJA reduced the corporate tax rate to 21%, many corporations found themselves with extra cash, which they used to buyback their own stock. After the lockout period in October and the first spikes in volatility, the buybacks declined significantly.

High valuations

After a 9-year bull market and a record low-interest environment, equity valuations reached levels not seen since the tech bubble. The S&P 500 was trading at P/E of 24.9 in the early January of 2018, away above the average level of 15.7. Even after the market sell-off S&P 500 is trading around 19 P/E.

Furthermore, the Shiller PE Ratio reached 33.3, one of the highest levels in history. After the market correction, the ratio stands at 27, away above the average of 16.5.

While the traditional Price to Earnings ratio is calculated based on current or estimated earnings levels, the Schiller ratio calculates average inflation-adjusted earnings from the previous ten years. The ratio is also known as the Cyclically Adjusted PE Ratio (CAPE Ratio) or PE10.

Price of Oil

After reaching $74.15 per barrel in October, US crude oil tumbled to $43, a 42% drop. While lower crude prices are pushing down on inflation, they are hurting energy stocks, which barely recovered from the previous fall in oil prices. Furthermore, the oil’s rapid decline is fueling fears for global oversupply and slowing economic growth.

The Fed’s continued hiking of interest rates in the US was not coordinated with its counterparts in the ECB, the UK, and Japan. Currently the US 10-year treasury yields 2.58%. At the same time, the German 10-year bund now yields 0.15%, while Japanese 10-year government bond went back in the negative territory of -0.01%. Combining the higher US rates with failing = Brexit talks, Italian budget crisis, and negative trade war outcome has led to a strong US dollar reaching a 17-month high versus other major currencies.

Strong dollar

Given that 40% of S&P 500 companies’ revenue comes from foreign countries, the strong dollar is making Americans goods and services more expensive and less competitive abroad. Furthermore, US companies generating earnings in foreign currency will report lower US-dollar denominated numbers.

Slowing global growth

The market decline in the last three months of 2018 came in the backdrop of strong corporate earnings and record high consumer optimism. Overall, the S&P 500 members reported record earnings in the Q3 of 2018. 78% of them have reported better than expected actual earnings with an average earnings growth rate of 25.2%.

On the other side, a growing number of companies in the S&P 500 (58 or 12%) have issued negative earnings guidance for Q4 2018 and beyond. Most recently Apple reported lower revenue guidance as a result of weak demand in China and lower than expected iPhone replacement in the US.

Corporate CFOs are starting to take a more defensive approach. Business investment grew only at a 0.8% annual rate in the third quarter, down from 8.7% in the second quarter. This was the slowest pace since the fourth quarter of 2016.

The investment bank Nomura also came out with the forecast expecting global growth to slow down. Their economists predicted that global growth in 2019 would hit 3.7% and temper to 3.5% in 2020 from 3.9% in 2018. According to Nomura, the drivers for the slowdown include waning fiscal stimulus in the U.S., tighter monetary policy from the Federal Reserve, increased supply constraints and elevated risk of a partial government shutdown.

Trade War

The impact of President Trump’s trade war is finally became obvious. With many US businesses relying on revenue from China and the EU, one company after another are starting to warn for lower revenue guidance in 2019.

The latest global PMI (Purchasing Managers Index) survey shows a slowdown in global production growth. According to JP Morgan and HIS Markit Survey: “The global manufacturing sector continued to register a subdued performance at the close of 2018. Output growth remained weak, while rates of expansion in new orders and employment both slowed. The trend in international trade flows also remained weak, with new export business declining for the fourth straight month. The JP Morgan Global Manufacturing PMI™ fell to a 27-month low of 51.5 in December, down from 52.0 in November. The average reading over the fourth quarter (51.8) was the lowest since quarter three of 2016.”

The housing market is slowing down

Both existing and new home sales have come down this year.  Rising interest rates, higher cost of materials, labor shortage and high real estate prices in major urban areas have led to a housing market slow down.  Existing home sales dropped 3.4% in September coming down for six months in a row this year. New building permits are down 5.5% over 2017.

The investors have taken a negative view of the housing market. As a result, most homebuilders, home improvement retailers, and lumber producers are trading at 52-week lows.

Consumer debt is at a record high

The US consumer debt is reaching 4 trillion dollars. Consumer debt includes non-mortgage debts such as credit cards, personal loans, auto loans, and student loans. Student loans are equal to $1.5 trillion while auto debt is $1.1 trillion and credit card debt is close to $1.05 trillion. Furthermore, the US housing dent also hit a record high. In June, the combined mortgage and home equity debt were equal to $9.43 trillion, according to the NY Fed. So far, the rising consumer debt has been supported by low delinquencies, higher property values, rising wages, and low unemployment. However, a slowdown in the economy paired with higher interest rates can putt his equilibrium at risk.

High Yield and BBB-rated debt is growing

The size of the US corporate debt market has reached $7.5 trillion. The size of the BBB rated debt, which is just one notch above junk status, now exceeds 50% of the entire investment grade market.

Bloomberg pointed out that, in 2000, when BBB bonds were only a third of the market, the corporate net leverage (total debt minus cash and short-term investments divided by earnings before interest, taxes, depreciation, and amortization) was 1.7 times. By the end of last year, the ratio had ballooned to 2.9 times.

Further on, the bond powerhouse PIMCO commented: “This suggests a greater tolerance from the credit rating agencies for higher leverage, which in turn warrants extra caution when investing in lower-rated IG names, especially in sectors where earnings are more closely tied to the business cycle.”

Interest rates

Interest rates were the hot topic of 2018 and will continue to be in 2019. With government debt passing $21 trillion and record high consumer and corporate, it is not a surprise that the market is very jittery to rising interest rates. The Fed hiked its overnight lending rate four times in 2018, to 2.25% – 2.50% level. Subsequently, the 10-year Treasury reached 3.24%, before falling to 2.58% as of January 3rd, 2019. In the meantime, the rates of the 2- and 5-year treasuries started to converge in what is known as inverted yield curve.

2019 Market Outlook. Convergence of interest 10-year, 5-year and 2-year rates  over the last 5 years
Convergence of interest 10-year, 5-year and 2-year rates over the last 5 years

2019 Outlook

The US Economy remains strong despite headwinds from multiple directions. Major macroeconomic factors are in positive territory.

  • Highest corporate earnings growth since 2010, over 25% over the first 3 quarters of 2018
  • The last quarter of S&P 500 EPS growth is expected to be between 12% and 15%
  • Equity valuations reach fair territory after the recent selloff.
  • GDP growth over 3%
  • Record high consumer sentiment
  • End of year holiday shopping is expected to beat all records
  • Record low unemployment
  • Highest wage growth since 2008
  • Business activity remains high
  • Interest rates remain under historical levels
  • Low oil prices will temper inflation and lower business cost

Many economists believe that we are in the last leg of economic expansion. And, some are even predicting a market recession in 2020. However, historically economists and equity have not been an accurate indicator for economic recessions. Realistically speaking it would be very hard to enter an economic downturn from where we are today unless we see a very steep deterioration of government policies and business and consumer spending.

Obviously, at this stage, it is hard to predict the equity markets in 2019. I am looking at three major scenarios, which all have realistic chances of developing.

Scenario 1 (30%)

The bull market continues. The US and China reach a mutually beneficial trade agreement. China commits to relax the rules of US firms conducting business in China and strengthen rules for parent protections. The Fed is more cautious about raising interest rates. Apple’s earnings are not as bad as the market is anticipating. Lower interest rates and oil prices help businesses manage their costs, offset slow down in housing sales and boost consumer spending. The corporate earnings growth beats analyst forecast across the board.

Scenario 2 (20%)

We could see another 10-20% decline in Global Stocks before reaching a bottom. Trump continues to criticize the Fed and interfere in its independence. The government shutdown and political bipartisanship continues without a long-term solution. The Brexit is a disaster. China and the US do not reach a meaningful trade agreement that satisfies the markets. Companies continue to report lower revenue and earnings guidance, and some may start laying off employees.  

Scenario 3 (50%)

Global stocks remain volatile for the first 6 months of the year with major swings in both directions. The equity market becomes extremely sensitive to both positive and negative news.

For long-term investors

The best investment strategy has always been buy-and-hold. Trying to time the market is a bad idea. There are many studies that show timing the market has underperformed a buy and hold strategy in the long run. For example, a long-term investor who bought SPY (SPDR S&P 500 ETF) on January 2nd, 2008 would have more than doubled her investment and achieve a 7.2% total return (price appreciations plus dividends).

If you are uncertain about the markets and achieving your financial goals, seek advice from a fiduciary advisor who has your best interest in mind.

About the author:

Stoyan Panayotov, CFA is the founder and CEO of Babylon Wealth Management, a fee-only investment advisory firm based in Walnut Creek, CA. Babylon Wealth Management offers personalized investment management and financial planning services to individuals and families.  To learn more visit our Private Client Services page here. Additionally, we offer Outsourced Chief Investment Officer services to professional advisors (RIAs), family offices, endowments, defined benefit plans, and other institutional clients. To find out more visit our OCIO page here.

Disclaimer: Past performance does not guarantee future performance. Nothing in this article should be construed as a solicitation or offer, or recommendation, to buy or sell any security. The content of this article is a sole opinion of the author and Babylon Wealth Management. The opinion and information provided are only valid at the time of publishing this article. Investing in these asset classes may not be appropriate for your investment portfolio. If you decide to invest in any of the instruments discussed in the posting, you have to consider your risk tolerance, investment objectives, asset allocation, and overall financial situation. Different investors have different financial circumstances, and not all recommendations apply to everybody. Seek advice from your investment advisor before proceeding with any investment decisions. Various sources may provide different figures due to variations in methodology and timing,

The December market meltdown explained

S&P 500 is down almost -16% so far in the last quarter of 2018. The market rout which started in October continued with a powerful selloff in December. The technology-heavy NASDAQ is down -20%, while the small-cap Russell 2000 dropped nearly -22%.

Despite our strong economy major buyers remain on the sideline and retail investors are looking for a bottom..

In my previous article, I talked about the perfect storm that started the market drop in October. Since then more negative news continued to bombard the markets. The markets do not like uncertainty.

Here are some of the factors that triggered fears across the sellers.

  1. Apple stopping to report iPhone sales
  2. FedEx reporting lower guidance for 2019
  3. The resignation of General Mattis
  4. Government shutdown
  5. Failing Brexit negotiations
  6. Trump criticizing the Fed
  7. The recent arrest of Huawei CFO and three Canadians in China
  8. The price of oil dropping to $43.
  9. Yield curve inversion
  10. Growin fears for an upcoming recession
  11. The dominance of electronic and algorithm trading
  12. Low trading volumes due to the holiday season

The combination of more negative news and low trading volumes created yet another perfect storm for what we observed in December 2018.

The asset classes performance

2018 will remain in history as the year when holding cash was the only profitable strategy.  Almost all major asset classes are in the red for 2018.

Future Outlook

As I mentioned earlier, all major macroeconomic factors are in a positive territory.

  • Highest corporate earnings growth since 2010
  • GDP growth over 3%
  • Record high consumer sentiment
  • End of year holiday shopping is expected to beat all records
  • Record low unemployment
  • Highest wage growth since 2008
  • Business activity remains high
  • Interest rates stay under historical levels
  • Low oil prices will temper inflation and business cost

Many economists believe that we are in the last leg of economic expansion. Moreover, some are even predicting a market recession in 2020. However, there is an old joke that the markets have predicted 9 out of the past 5 recessions. In spite the fact that equity markets are forward-looking, they have not been an accurate indicator for an economic recession.

Realistically speaking it would be very hard to enter recession from where we are today unless we see a very steep deterioration in 2019.

The law of mean reversion.

Everything reverts to the mean sooner or later. Last year we had one of the least volatile markets in our recent history. As a result, the S&P 500 standard deviation, a measure of risk, dropped to 3.8% well below average historical levels of 13%. This year’s market volatility is back to these average levels.

Diversify

In any market environment, volatile or not, diversification is essential way to reduce portfolio risk.

Think long term

The best long-term investment strategy has always been buy-and-hold. Trying to time the market is a bad idea. There are many studies that show timing the market would underperform a buy and hold strategy in the long run.

Don’t watch the market every day.

Media skews the news to what is trendy and get more readership.

Use your best judgement.

Panicking has never helped anyone. If you are uncertain seek advice from a fiduciary advisor who has your best interest in mind. 

About the author:

Stoyan Panayotov, CFA is the founder and CEO of Babylon Wealth Management, a fee-only investment advisory firm based in Walnut Creek, CA. Babylon Wealth Management offers personalized wealth management and financial planning services to individuals and families.  To learn more visit our Private Client Services page here. Additionally, we offer Outsourced Chief Investment Officer services to professional advisors (RIAs), family offices, endowments, defined benefit plans, and other institutional clients. To find out more visit our OCIO page here.

Disclaimer: Past performance does not guarantee future performance. Nothing in this article should be construed as a solicitation or offer, or recommendation, to buy or sell any security. The content of this article is a sole opinion of the author and Babylon Wealth Management. The opinion and information provided are only valid at the time of publishing this article. Investing in these asset classes may not be appropriate for your investment portfolio. If you decide to invest in any of the instruments discussed in the posting, you have to consider your risk tolerance, investment objectives, asset allocation, and overall financial situation. Different investors have different financial circumstances, and not all recommendations apply to everybody. Seek advice from your investment advisor before proceeding with any investment decisions. Various sources may provide different figures due to variations in methodology and timing,