Tag Fixed Income
Market Outlook October 2019
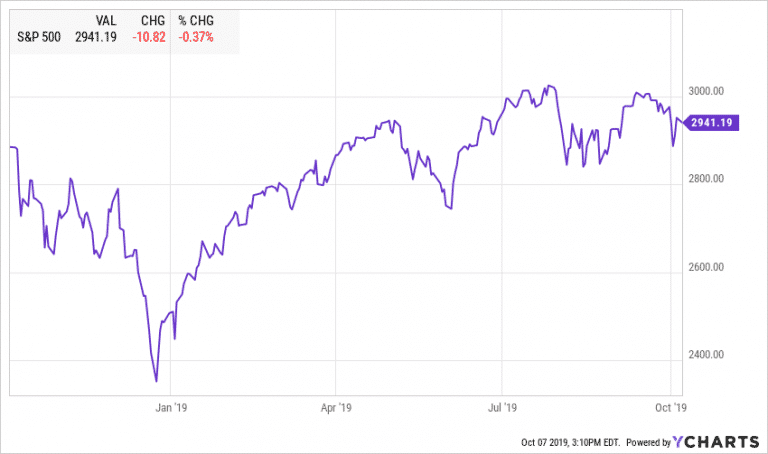
Highlights: Economic Overview Equities US Equities had a volatile summer. Most indices are trading close to or below early July levels and only helped by dividends to reach a positive quarterly return. On July 27, 2019, S&P 500 closed at…
Why negative interest rates are bad for your portfolio
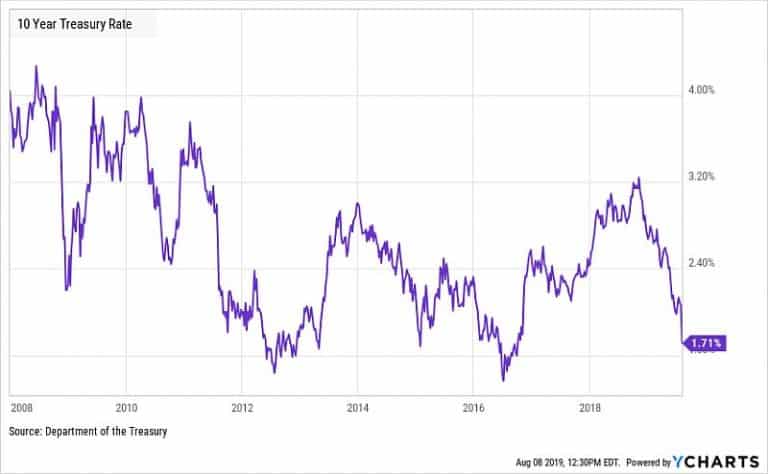
Quantitative Easing Ever since the financial crisis of 2008-2009, central banks around the world have been using lower interest rates and Quantitative Easing (QE) to combat to slow growth and recession fears. In the aftermath of the Great Recession, all…
Market Outlook July 2019
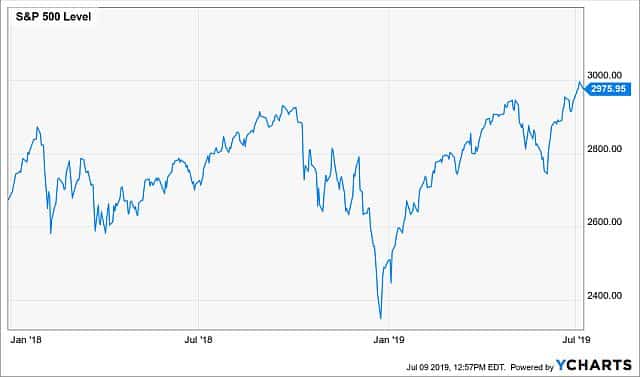
Breaking records So far 2019 has been the year of breaking records. We are officially in the longest economic expansion, which started in June of 2009. After the steep market selloff in December, the major US indices have recovered their…
Contact Us