Tag Gold
Market Outlook October 2019
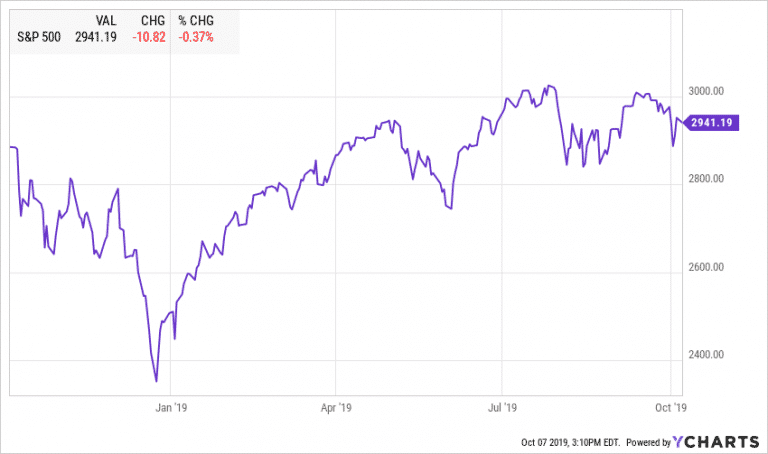
Highlights: Economic Overview Equities US Equities had a volatile summer. Most indices are trading close to or below early July levels and only helped by dividends to reach a positive quarterly return. On July 27, 2019, S&P 500 closed at…
Market Outlook July 2019
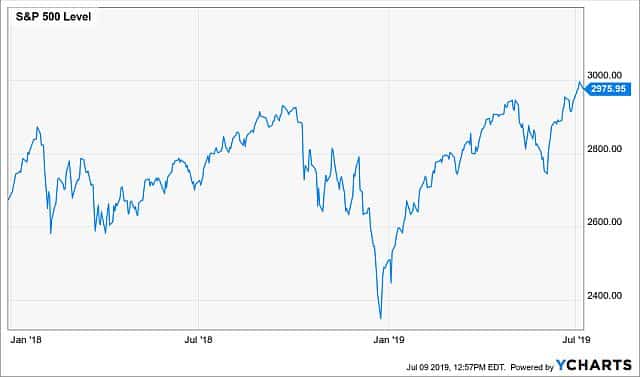
Breaking records So far 2019 has been the year of breaking records. We are officially in the longest economic expansion, which started in June of 2009. After the steep market selloff in December, the major US indices have recovered their…
Market Outlook October 2018

Overview The US stock market was on an absolute tear this summer. S&P 500 went up by 7.65% and completed its best 3rd quarter since 2013. Despite the February correction, the US stocks managed to recover from the 10% drop. All…
Market Outlook April 2018
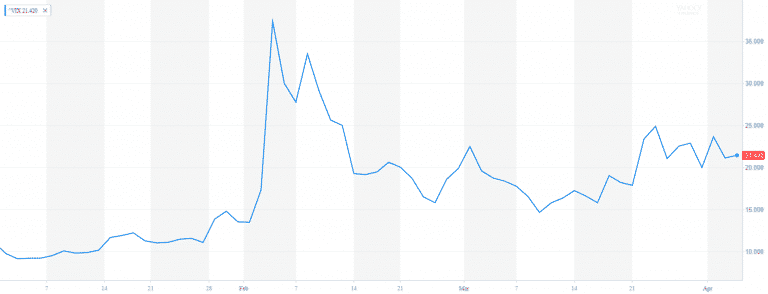
Market Outlook April 2018 After a record high 2017, the volatility has finally returned. Last year the market experienced one of the highest risk-adjusted performances in recent history. In 2017 there were only 10 trading where the S&P 500 moved…
Market Outlook December 2017
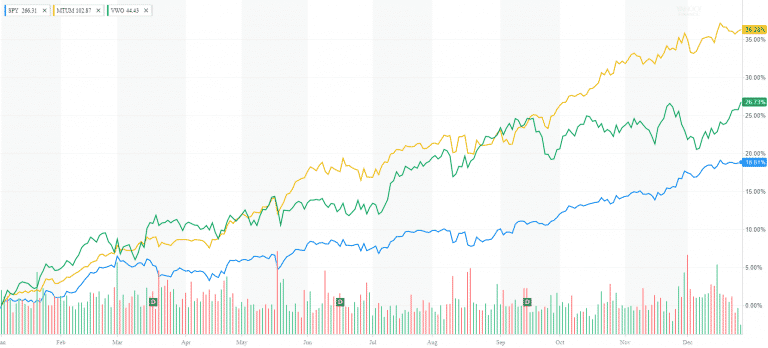
Market Outlook December 2017 As we approach 2018, it‘s time to reconcile the past 365 days of 2017. We are sending off a very exciting and tempestuous year. The stock market is at an all-time high. Volatility is at a…
End of Summer Market Review
End of Summer Market Review Happy Labor Day! Our hearts are with the people of Texas! I wish them to remain strong and resilient against the catastrophic damages of Hurricane Harvey. As someone who experienced Sandy, I can emphasize with…
Top 5 Strategies to Protect Your Portfolio from Inflation

Protecting Your Portfolio from Inflation The 2016 election revived the hopes of some market participants for higher interest rates and higher inflation. Indeed, the 10-year Treasury rate went from 1.45% in July to 2.5% in December before settling at around…
Contact Us