Tag Markets
What to expect from the stock market in 2025?

As we step into 2025, we will eagerly watch the stock market again, hoping to build on the gains of the past two years. While no one can predict market direction with absolute certainty, a combination of recent market trends,…
Investing during election and how to beat uncertainty

Investing during election years often brings market uncertainty due to the potential for policy shifts. This uncertainty can prompt some investors to hold cash, fearing volatility, while others stay fully invested. Based on historical trends, market behavior, and investment principles,…
Why investors should cheer this bear market

There is no doubt that 2022 has been a brutal year for investors. Many marquee household companies are down 30%, 40%, and 50%. Some have posted their worst performance in their history. The conservative bond investors didn’t have much to…
Bear market bottom and 10 sign to help you recognize it

A bear market bottom is often elusive and hard to identify. Every investor dreams of timing the stock market bottom and consistently buying low and selling high. But in reality, catching the bear market bottom is hard, even for experienced…
15 Costly retirement mistakes

15 Costly retirement mistakes… Retirement is a major milestone for many Americans. Retiring marks the end of your working life and the beginning of a new chapter. As a financial advisor, I help my clients avoid mistakes and retire with…
Guide to the coronavirus economic fallout

Our guide to the coronavirus economic fallout. The world is facing the biggest health crisis in 100 years. The COVID-19 outbreak has infected over 2 million people worldwide and caused hundreds of thousands of lost lives. The unprecedented global lockdown…
The Coronavirus and your money

The Coronavirus and your money. After an unprecedented 10% rally, which started in October of 2019, the stock market is finally hitting a rough patch. The quick spread of the coronavirus in China and around the world made investors nervous…
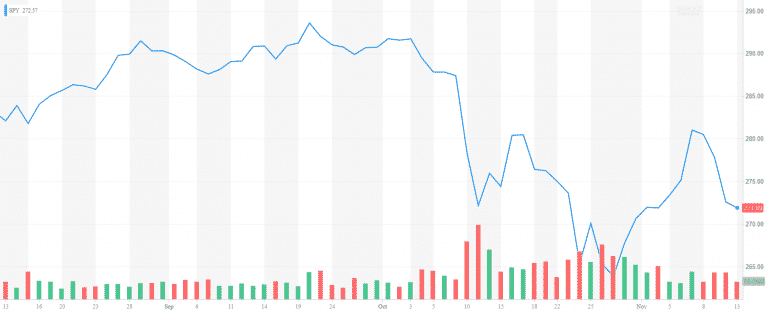
Market Outlook October 2019
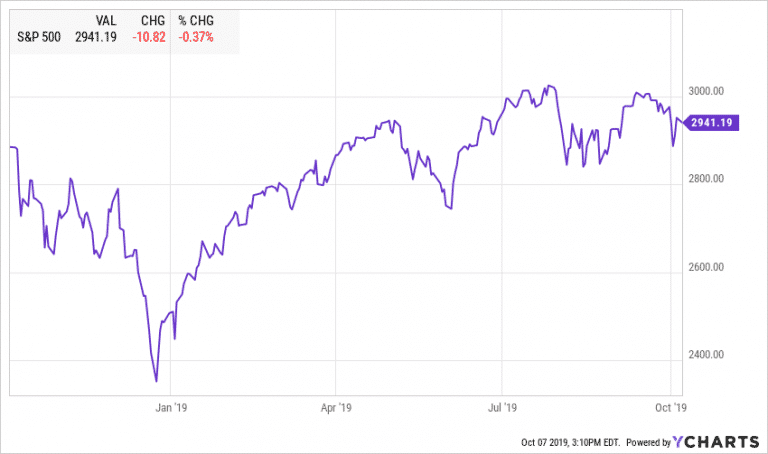
Highlights: Economic Overview Equities US Equities had a volatile summer. Most indices are trading close to or below early July levels and only helped by dividends to reach a positive quarterly return. On July 27, 2019, S&P 500 closed at…
Market Outlook July 2019
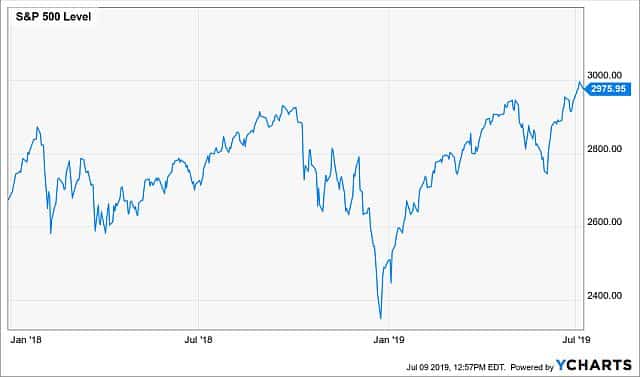
Breaking records So far 2019 has been the year of breaking records. We are officially in the longest economic expansion, which started in June of 2009. After the steep market selloff in December, the major US indices have recovered their…
Market Outlook April 2019
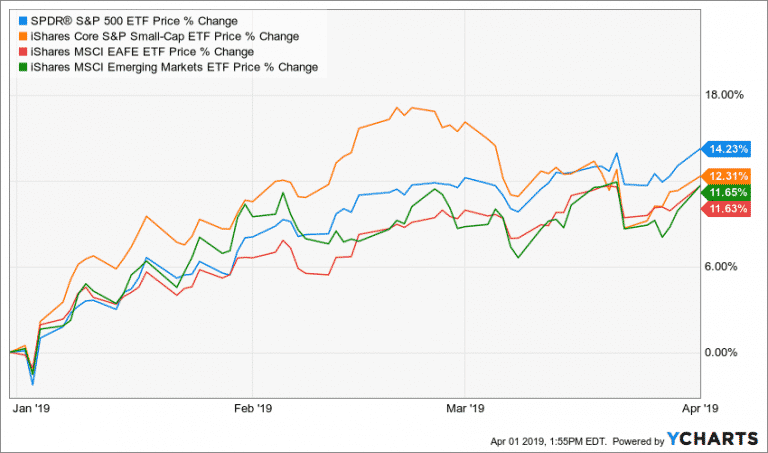
In my last commentary in early January, right after the December vortex, I gave 30% chance that the bull market will recover and 50% chance that we will see more volatility in the upcoming six months. My view of the…
Market Outlook 2019
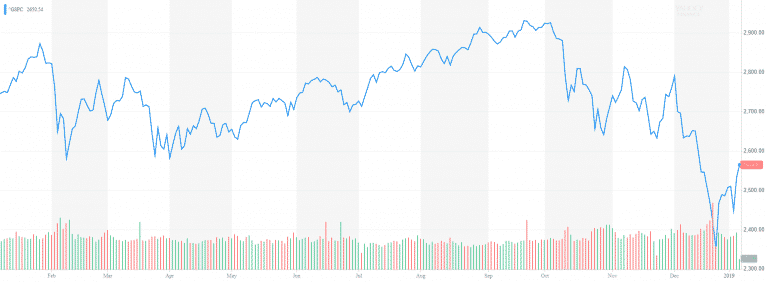
Happy New Year to all! 2018 kept us on our toes. It seems that 2019 is promising to do the same. All major world indices posted declines in 2018. S&P 500 finished lower by -4.5%. While the small-cap S&P 600…
The December market meltdown explained

S&P 500 is down almost -16% so far in the last quarter of 2018. The market rout which started in October continued with a powerful selloff in December. The technology-heavy NASDAQ is down -20%, while the small-cap Russell 2000 dropped…
The recent market volatility – the tale of the perfect storm
The recent market volatility – the tale of the perfect storm October is traditionally a rough month for stocks. And October 2018 proved it. S&P 500 went down -6.9% in October after gaining as much as 10.37% in the first…
Market Outlook October 2018

Overview The US stock market was on an absolute tear this summer. S&P 500 went up by 7.65% and completed its best 3rd quarter since 2013. Despite the February correction, the US stocks managed to recover from the 10% drop. All…
Market Outlook April 2018
Market Outlook April 2018 After a record high 2017, the volatility has finally returned. Last year the market experienced one of the highest risk-adjusted performances in recent history. In 2017 there were only 10 trading where the S&P 500 moved…
Biggest Risks for the Markets in 2018
Biggest Risks for the Markets in 2018 Wall Street is gearing for another record year on the equity market. On January 2nd Nasdaq crossed 7,000. A day later S&P 500 reached 2,700. Dow Jones followed by passing over 25,000. Who…
Market Outlook December 2017
Market Outlook December 2017 As we approach 2018, it‘s time to reconcile the past 365 days of 2017. We are sending off a very exciting and tempestuous year. The stock market is at an all-time high. Volatility is at a…
End of Summer Market Review
End of Summer Market Review Happy Labor Day! Our hearts are with the people of Texas! I wish them to remain strong and resilient against the catastrophic damages of Hurricane Harvey. As someone who experienced Sandy, I can emphasize with…
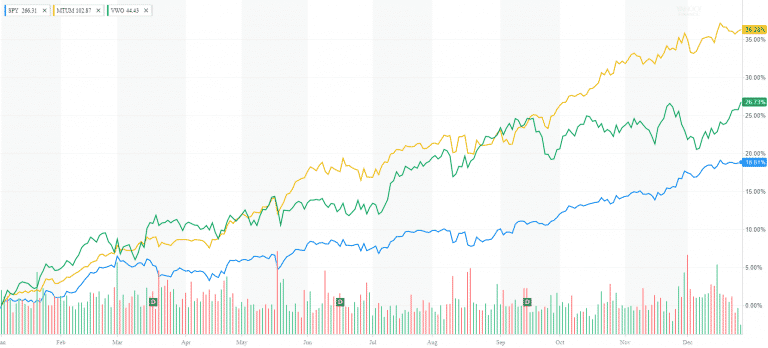
Will Small Caps continue to rally under Trump Presidency?
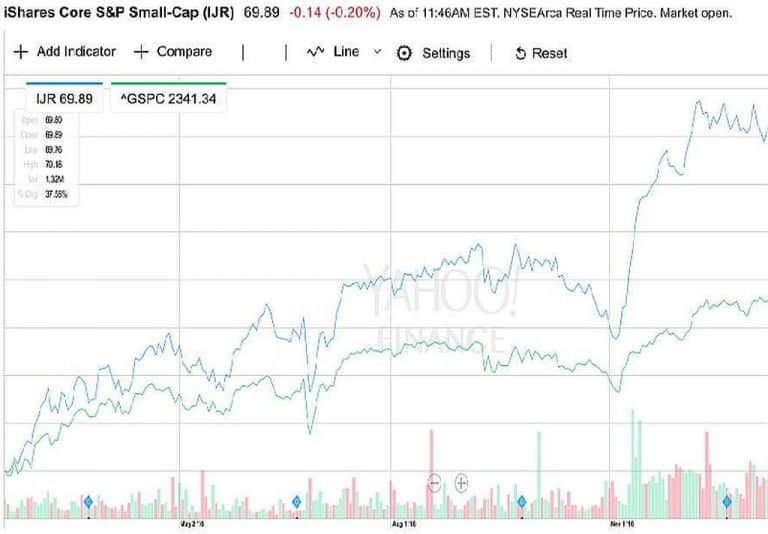
Small Cap stocks are a long-time favorite of many individual investors and portfolio manager. The asset class jumped 38% since the last election. Will Small Caps continue to rally under Trump Presidency? Can they maintain their momentum? The new president Trump…
6 Proven strategies for volatile markets

What are some of the proven strategies for volatile markets? The truth is nobody likes to lose money. Especially money that is earmarked for retirement, vacation, real estate purchase, or college education. Today’s volatile markets can be treacherous for inexperienced (and…
Contact Us