Tag Risk management
Understanding Tail Risk and how to protect your investments

What is Tail Risk? Tail Risk is the possibility of suffering large investment losses due to sudden and unforeseen events. The name tail risk comes from the shape of the bell curve. Under normal circumstances, your most likely investment returns…
Benefits and drawbacks to buying Indexed Universal Life Insurance

Today, I am going off the beaten path for me and will discuss the pros and cons of buying Indexed Universal Life Insurance. As a fee-only advisor, I do not sell any insurance or commission-based products. However, on numerous occasions,…
15 Costly retirement mistakes

15 Costly retirement mistakes… Retirement is a major milestone for many Americans. Retiring marks the end of your working life and the beginning of a new chapter. As a financial advisor, I help my clients avoid mistakes and retire with…
The recent market volatility – the tale of the perfect storm
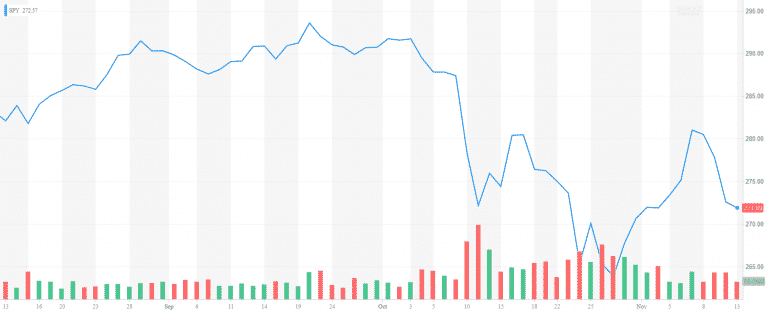
The recent market volatility – the tale of the perfect storm October is traditionally a rough month for stocks. And October 2018 proved it. S&P 500 went down -6.9% in October after gaining as much as 10.37% in the first…
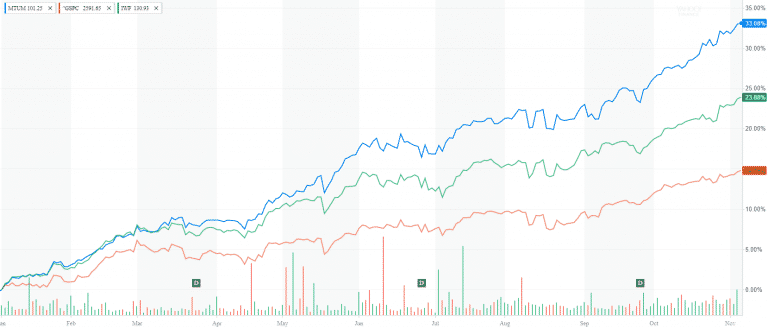
Market Outlook October 2018

Overview The US stock market was on an absolute tear this summer. S&P 500 went up by 7.65% and completed its best 3rd quarter since 2013. Despite the February correction, the US stocks managed to recover from the 10% drop. All…
Market Outlook April 2018
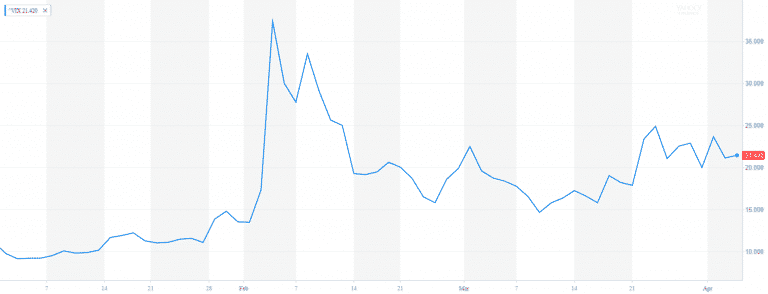
Market Outlook April 2018 After a record high 2017, the volatility has finally returned. Last year the market experienced one of the highest risk-adjusted performances in recent history. In 2017 there were only 10 trading where the S&P 500 moved…
Biggest Risks for the Markets in 2018

Biggest Risks for the Markets in 2018 Wall Street is gearing for another record year on the equity market. On January 2nd Nasdaq crossed 7,000. A day later S&P 500 reached 2,700. Dow Jones followed by passing over 25,000. Who…
Market Outlook December 2017
Market Outlook December 2017 As we approach 2018, it‘s time to reconcile the past 365 days of 2017. We are sending off a very exciting and tempestuous year. The stock market is at an all-time high. Volatility is at a…
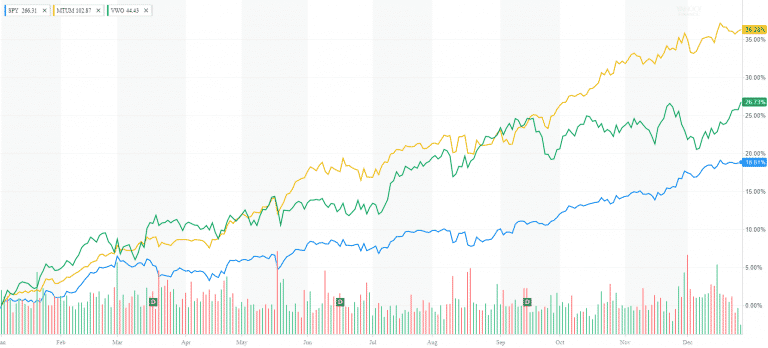
The Rise of Momentum Investing
The Rise of Momentum Investing While the momentum theory has been around for two decades, we had to wait until 2017 to see the rise of momentum investing. The largest momentum ETF (MTUM) is up 35% YTD. And unless something…
6 Saving & Investment Practices All Business Owners Should Follow

In my practice, I often meet with small business owners who have the entire life savings and family fortune tied up to their company. For many of them, their business is the only way out to retirement. With this post,…
End of Summer Market Review
End of Summer Market Review Happy Labor Day! Our hearts are with the people of Texas! I wish them to remain strong and resilient against the catastrophic damages of Hurricane Harvey. As someone who experienced Sandy, I can emphasize with…
6 Essential steps to diversify your portfolio

Diversification is often considered the only free lunch in investing. In one of my earlier blog posts, I talked about the practical benefits of diversification. I explained the concept of investing in uncorrelated asset classes and how it reduces the…
Top 5 Strategies to Protect Your Portfolio from Inflation

Protecting Your Portfolio from Inflation The 2016 election revived the hopes of some market participants for higher interest rates and higher inflation. Indeed, the 10-year Treasury rate went from 1.45% in July to 2.5% in December before settling at around…
4 Steps to determine your target asset allocation

One of the financial advisors’ primary responsibilities is to determine and document their clients’ target asset allocation. The target allocation serves as a starting point and guideline in diversifying the client portfolio and building future wealth. Clients’ unique financial goals,…
Introduction to portfolio diversification

Introduction Portfolio diversification is one of the main pillars of retirement planning. The old proverb “Never put all your eggs in one basket” applies in full strength to investing. Even the Bible talks about diversification. Ecclesiastes 11:2 says “Divide your portion…
Contact Us